How Fast Should a Website Load? Core Web Vitals Benchmarks Every Developer Must Know
 11 Min Read
 July 12, 2026
 cf_admin


The Answer Most Developers Get Wrong
How fast should a website load?
Most people say “under 3 seconds.” That’s not wrong, but it’s not the full picture either.
Google no longer thinks about website speed as a single number. It breaks performance into three specific measurements called Core Web Vitals. Each one looks at a different part of how your site feels to a real user. Together, they determine whether your site is fast enough to rank well, convert visitors, and keep people from bouncing.
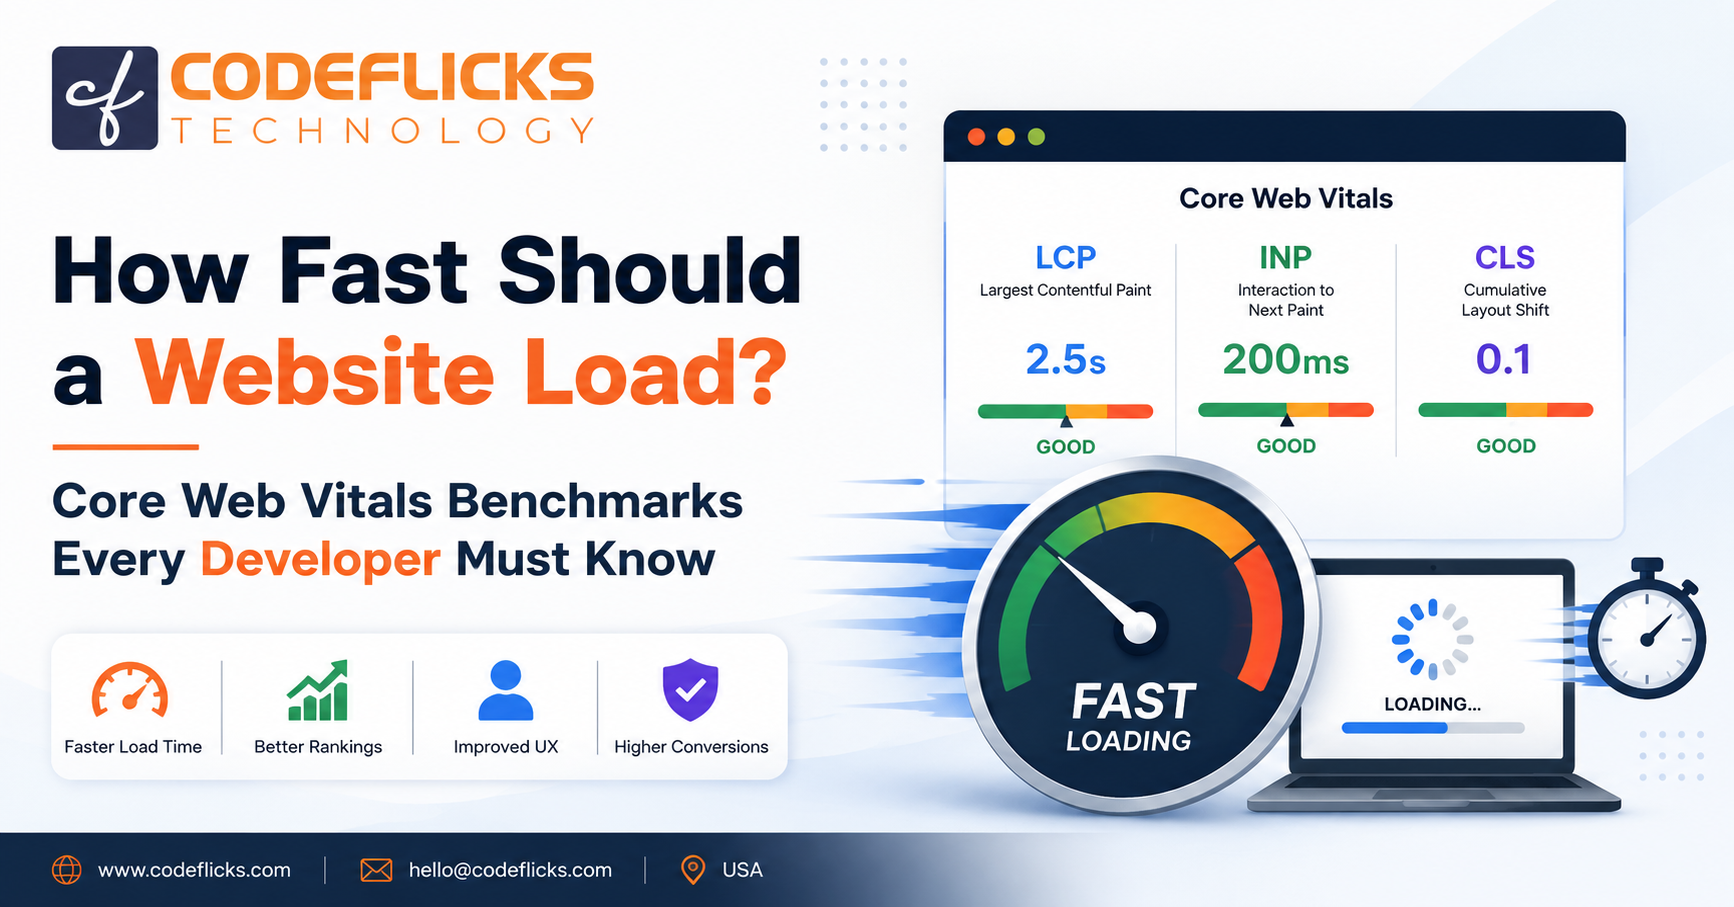
Here’s the short version of the benchmarks you need to hit:
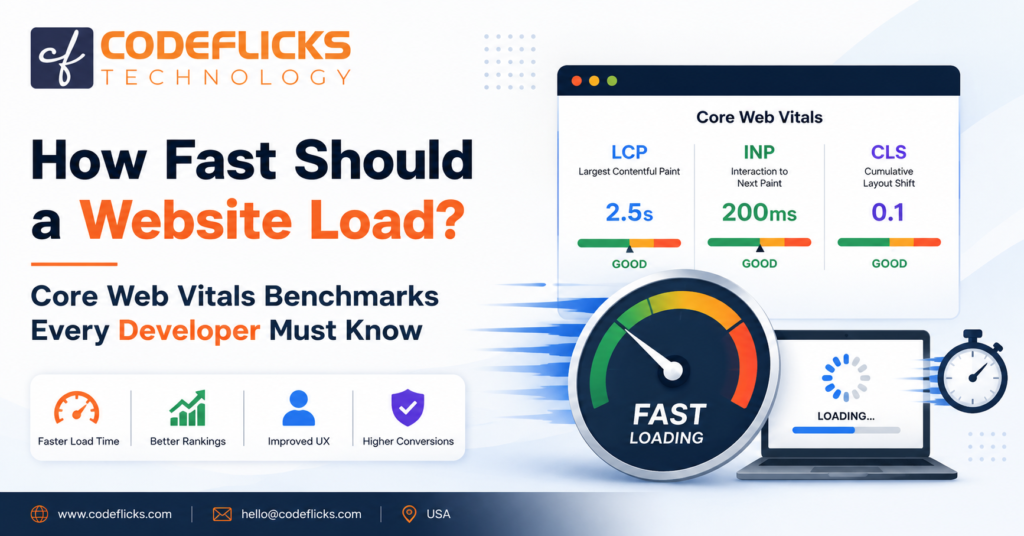
- LCP (Largest Contentful Paint): under 2.5 seconds
- INP (Interaction to Next Paint): under 200 milliseconds
- CLS (Cumulative Layout Shift): under 0.1
If you’re wondering how fast your website loads right now, you can check it instantly using Google PageSpeed Insights. It’s free, takes 30 seconds, and gives you scores for both mobile and desktop.
This guide explains what each metric means, what scores to aim for, and what happens to your business when you miss them.
Why Website Speed Is a Business Problem, Not Just a Tech Problem
Before we get into the numbers, it’s worth understanding why this matters beyond SEO.
47% of consumers expect a webpage to load in 2 seconds or less. When your page misses that mark, people leave. And they don’t come back.
Here’s what the data shows:
- A page that loads in 1 second has a 7% bounce rate. At 5 seconds, that jumps to 38%.
- Ecommerce sites that load in 1 second have conversion rates roughly 3x higher than sites that take 5 seconds.
- Every second of delay between 0 and 5 seconds reduces your conversion rate by an average of 4.42%.
- If a mobile page takes more than 3 seconds to load, 53% of visitors will leave before it finishes.
Speed is not a developer concern. It is a revenue concern.
What Are Core Web Vitals?
Core Web Vitals are Google’s official set of performance metrics. Google introduced them in 2020 and made them a confirmed ranking signal in 2021. They measure three things that matter most to real users: how fast your page loads, how quickly it responds to clicks, and whether it stays visually stable while loading.
There are three metrics in 2026:
1. LCP: Largest Contentful Paint
This measures how long it takes for the largest visible element on your page to load. That’s usually a hero image, a large heading, or a video thumbnail.
Good: under 2.5 seconds. Needs improvement: 2.5 to 4.0 seconds. Poor: over 4.0 seconds.
LCP is the metric most sites fail. As of the latest CrUX data from June 2026, only 68.6% of tracked websites pass the LCP threshold. On mobile, the pass rate drops even lower, to around 62%.
The most common causes of slow LCP are unoptimized images, slow server response times, and render-blocking CSS or JavaScript.
2. INP: Interaction to Next Paint
This replaced the old FID (First Input Delay) metric in March 2024. INP measures how quickly your page responds to any user interaction, not just the first one. That includes clicks, taps, and key presses across the entire session.
Good: under 200 milliseconds. Needs improvement: 200 to 500 milliseconds. Poor: over 500 milliseconds.
INP is significantly harder to pass than FID was. 43% of sites still fail the 200ms threshold, making INP the most commonly failed Core Web Vital for many developers working on interactive pages. Heavy JavaScript and long tasks on the main thread are usually the culprit.
3. CLS: Cumulative Layout Shift
This measures visual stability. If elements on your page move around while it’s loading, like a button jumping down when an image loads above it, that registers as a layout shift.
Good: under 0.1 Needs improvement: 0.1 to 0.25 Poor: over 0.25
CLS is the easiest metric to pass, and 86.6% of sites now achieve a good INP score, while 81.3% pass CLS, making it the strongest area across the web. The fix is usually simple: set explicit width and height on all images and reserve space for ads or dynamic content before they load.
How Does Google Measure These?
Google measures Core Web Vitals using real user data from Chrome browsers. This is called field data, collected through the Chrome UX Report (CrUX).
To pass Core Web Vitals, 75% of your real visitors must experience a “good” score for each metric. That means you cannot just optimize for one type of device or connection. You have to perform well across the range of people actually visiting your site.
Google PageSpeed Insights is the easiest way to see your current scores. It combines real user data with simulated lab testing from Lighthouse to give you both a big-picture score and specific recommendations to fix.
Other tools worth using:
- Google Search Console shows CWV performance across your entire site, not just individual pages
- WebPageTest lets you test from different geographic locations and device types
- DebugBear provides continuous monitoring so you catch regressions before users do
How Fast Should a Webpage Load? Benchmarks by Industry
The Core Web Vitals thresholds are universal, but competitive benchmarks vary by industry. Hitting “good” is the floor. Beating your competitors is the real goal.
| Industry | Realistic LCP Target | Notes |
| Ecommerce | Under 2.2 seconds | Directly tied to conversion rate |
| SaaS / B2B | Under 2.5 seconds | Affects trial signups and demo requests |
| Media / Publishing | Under 2.0 seconds | High traffic makes every second count |
| Local Business | Under 3.0 seconds | Mobile performance is especially critical |
| Healthcare | Under 2.5 seconds | Trust and UX are closely linked |
Top ecommerce sites like Amazon and Zalando maintain a median LCP below 1.8 seconds and CLS below 0.04. That is the bar serious players are hitting. For mid-sized sites, under 2.2 seconds for LCP is a realistic and competitive target.
How Fast Does Your Website Load? Check It Right Now
Not sure where your site stands? Here’s how to find out in under 5 minutes.
Step 1: Go to pagespeed.web.dev
Step 2: Enter your URL and click Analyze
Step 3: Look at your mobile score first. Mobile is what Google primarily uses for ranking.
Step 4: Check your three Core Web Vital scores: LCP, INP, and CLS
Step 5: Scroll down to the Opportunities and Diagnostics sections for specific fixes
Pay attention to the “Field Data” section at the top, not just the lab scores. Field data reflects your actual visitors. Lab data is a simulation. Both matter, but field data is what Google uses for ranking.
The Most Common Reasons Websites Fail Core Web Vitals
Most sites that fail Core Web Vitals have one or more of these problems:
Unoptimized images are the biggest cause of poor LCP. Large, uncompressed images in formats like JPEG or PNG load slowly. Switching to WebP and using lazy loading for below-the-fold images makes a significant difference.
Render-blocking JavaScript and CSS delay how quickly the browser can display anything on screen. Deferring non-critical scripts and inlining critical CSS removes this bottleneck.
Slow server response times (TTFB) mean the browser waits a long time before it even starts downloading anything. A good TTFB is under 200ms. If yours is higher, your hosting, server configuration, or lack of a CDN is likely the issue.
No CDN (Content Delivery Network) means all users are loading your site from a single server location. A CDN serves your content from servers close to each visitor, cutting load time dramatically for anyone not near your origin server.
Missing image dimensions cause layout shifts. If your HTML does not specify the width and height of an image, the browser does not reserve space for it while loading. When the image appears, everything else moves.
Heavy third-party scripts like chat widgets, advertising pixels, and analytics tools add to your page weight and can delay both LCP and INP. Audit what you actually need.
How Site Speed Affects SEO Rankings
Speed has been a Google ranking signal since 2018. But it works more like a tiebreaker than a primary factor.
Core Web Vitals primarily act as a tiebreaker: when content quality and relevance are comparable between two pages, the faster, more stable page has the advantage.
That means great content still comes first. But in competitive niches where many sites have strong content, speed is often what separates a page ranking on page one from one stuck on page two.
There are also indirect SEO effects that matter just as much:
A slow site leads to higher bounce rates. Google interprets high bounce rates as a signal that users did not find what they were looking for. Over time, this can push your rankings down even if your content is good.
A fast site keeps people on the page longer, increases the number of pages they visit, and makes them more likely to convert or return. All of those signals help your rankings indirectly.
What Good Scores Look Like in Practice
To summarize everything in one place:
| Metric | Good | Needs Improvement | Poor |
| LCP | Under 2.5s | 2.5s to 4.0s | Over 4.0s |
| INP | Under 200ms | 200ms to 500ms | Over 500ms |
| CLS | Under 0.1 | 0.1 to 0.25 | Over 0.25 |
As of June 2026, only 55.9% of all tracked websites pass all three Core Web Vitals at once. That means nearly half the web is still underperforming by Google’s standards. Hitting all three is not just best practice. It’s a real competitive advantage.
How Codeflicks Helps You Hit These Benchmarks
Passing Core Web Vitals is not something you do once and forget. Every code deployment, new image, new third-party script, or design change can push your scores in either direction.
At Codeflicks, performance is built into the development process, not bolted on at the end. Our team audits your current scores, identifies exactly which issues are causing you to miss thresholds, and implements fixes that hold up over time. That includes image optimization pipelines, CDN configuration, lazy loading, script deferral, and server-side rendering, where it makes sense.
Whether you are building a new website from scratch or trying to fix a slow one, the goal is the same: scores in the green across all three metrics on mobile and desktop.
See how we approach web performance as part of our full website development process. You can also read our breakdown of how much a website costs to build in 2026 or explore our guide to mobile app performance optimization.
Get a free performance audit from Codeflicks today. We will tell you exactly where your site stands and what it will take to fix it.
Frequently Asked Questions
How fast should a website load in 2026?
Your largest visible element (LCP) should load in under 2.5 seconds. For competitive industries like ecommerce, under 2.0 seconds is a stronger target. The overall goal is to pass all three Core Web Vitals: LCP, INP, and CLS.
How do I check how fast my website loads?
Go to pagespeed.web.dev, enter your URL, and click Analyze. You will get scores for both mobile and desktop, along with specific recommendations. Check your mobile score first, as that is what Google primarily uses for rankings.
What is a good website speed score?
On Google PageSpeed Insights, a score of 90 or above is considered good. A score of 50 to 89 needs improvement. Under 50 is poor. But the score itself matters less than whether your three Core Web Vitals metrics are in the “good” range individually.
Does website speed affect SEO?
Yes. Speed has been a Google ranking signal since 2018. Core Web Vitals are a confirmed part of Google’s Page Experience signals. Sites that pass all three Core Web Vitals thresholds see 24% lower bounce rates, which also helps rankings indirectly.
What is the most common Core Web Vitals failure?
LCP. Only about 62% of mobile pages pass the LCP threshold globally. Slow-loading hero images and poor server response times are the most frequent causes.
How often should I check my Core Web Vitals?
At a minimum, after every major site update or deployment. Ideally, you should have continuous monitoring in place so you catch regressions automatically rather than discovering them weeks later.
Need help improving your scores? Start with our free website performance audit, browse our web development services, or read how we helped a client cut their LCP by 60%. If you are building something new, our website cost breakdown guide is a good next step.
Ready to build your own delivery app? Contact Codeflicks for a free scoped estimate within 48 hours.
You can also explore our on-demand app development services,
read our full guide to mobile app development costs, or see how we’ve helped restaurant brands go direct.
Read our full guide on Healthcare App Development Cost
cf_admin
Chief Technology Officer, CodeFlicks